The Driver Syndicate/Scripting/VS Code and Debugger setup
Introduction to Script Debugging
Since December 2024 Patch 2 update it is possible to debug your Lua scripts using VS Code.
Why Debugging?
As game Lua code of base game became complex and addons may get more and more complex over time, it is important to have not just a text editor for your scripts but exactly to know how your game scripts function.
But sometimes it's not enough to just know your code - you may notice that sometimes things break in unexpected ways - like you chose different vehicle, or put menu elements in some other ways, or after game update.
Inspecting your game code execution step-by-step may become difficult without proper tools, and here where debugger is to help.
Main debugger features
- Breakpoints
- Pause program execution at specific lines of code to inspect variables and program state.
- Supports conditional breakpoints (trigger only when certain conditions are met).
- Step Execution
- Step Over – Execute the current line and move to the next, without stepping into function calls.
- Step Into – Enter the function call to debug inside it.
- Step Out – Finish the current function and return to the caller.
- Exception handling
- If game has Lua script error encountered, debugger will stop game execution and show file and line where error is occurred
- Watch Variables & Expressions
- Monitor specific variables or expressions in real-time as the program executes.
- Call Stack Inspection
- View the sequence of function calls that led to the current execution point.
- Helps trace the source of errors and unexpected behaviors.
- Memory and Variable Inspection
- Examine contents of the variables and tables
Game uses Lua Local Debugger - it's setup is pretty simple and has most of the needed debugging features
Getting Started
Before proceed, you need to have installed Visual Studio Code: https://code.visualstudio.com/
- Open VS Code
- Go to
File -> Open Workspace from file... - Locate workspace file at
<DrvSyn Install Folder>/GameData/scripts/drvsyn-scripts.code-workspace - Install required extensions (VS Code will suggest you two extensions)
- Edit
<DrvSyn Install Folder>/GameData/scripts/.vscode/launch.jsonand replace Bin64 with Bin64SDK - Go to
Run -> Start Debugging(Or press F5) and game will be launched with Lua code debugger
See this tutorial article on how to use debugger https://code.visualstudio.com/docs/editor/debugging
Working with Mods & Addons
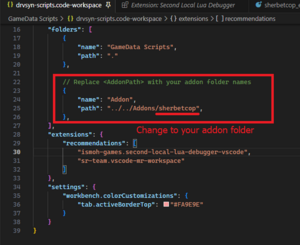
The workspace file drvsyn-scripts.code-workspace set up in such way it allows to edit and debug not only base game scripts, but also mods or addons you're working on.
In order to start editing and debugging your mod/addon you need to edit workspace file and specify your addon folder
After doing that, you're now able to see your Addon scripts and resources in Explorer alongside with GameData scrippts
